This is the stable catalog for the World Bank new business density files entrpr republishes. entrpr did not collect the observations. The definition and the 2024 findings are separate pages and are not repeated here.
Source to name with that citation: World Bank, World Development Indicators, IC.BUS.NDNS.ZS and IC.BUS.NREG, licensed CC BY 4.0. entrpr is the publisher of this derivative, not the collector of the observations.
Same addresses stay in place when a weekly rebuild replaces the bytes. Checksums below are SHA-256 of those bytes. CSV files are UTF-8 with a byte order mark so spreadsheet apps detect the encoding. JSON is UTF-8 without a byte order mark. A blank CSV cell is a null, not a zero.
| File | Bytes | SHA-256 |
|---|---|---|
| wdi-new-business-density-2024.csv | 11323 | b8cf467fda904e8bcc3244a48c219cb483e2a190ff17c22fe90eef3330fb0c3f |
| wdi-new-business-density-latest.csv | 17115 | c71486bab5da42d65ab9ebebaa5f35d612e0a8dd36b144513fbe489c600b9b08 |
| wdi-new-business-density-panel.csv | 203667 | 0dd8944891b9fa4adfe25eef3d6c73120c142f2dade9d08a2ead3e42821bf8ba |
| wdi-regional-medians-2024.csv | 1406 | c60b488887699bec41fe51fd1bdcd10d66b94f12837164634c99e9102d6b75f8 |
| wdi-panel-median-2006-2024.csv | 293 | 4123e6c9573c38c73cb2db1baa1a2c90589311439c0d729e52980a0cde23709d |
| global-business-formation-2024.json | 23398 | 8afbaf88e78377e89574e745a581063cdc9a39c429a8e35d83d48c91de4ec05e |
The same hashes, without this HTML page, are in SHA256SUMS.txt. A download is the browser opening that file. entrpr does not record whether the save finished. Plausible stays deferred on entrpr pages, and this catalog does not send a custom event for a download, a citation copy, or an embed copy. The embed file does not load Plausible. Referring domains are reviewed monthly outside this site.
134 economies have a 2024 new business density value. The median is 2.61 firms per 1,000 people ages 15-64. 134 of those rows also have a 2024 registration count. Registration counts answer a different question from density. Both columns are in wdi-new-business-density-2024.csv. The full table is on the definition page, with the same values.
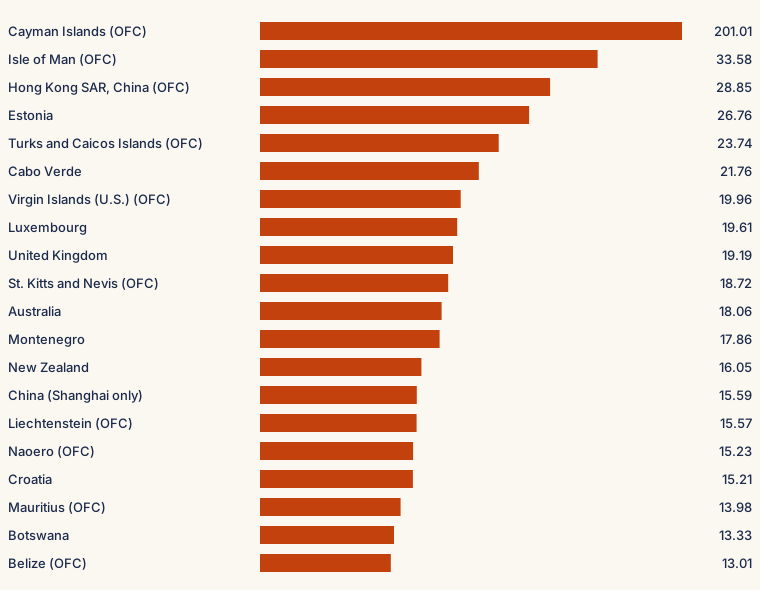
Highest 2024 density in that file: Cayman Islands (CYM), 201.01. This economy is on the Eurostat offshore financial center list. Outside that offshore list, Estonia is highest at 26.76.
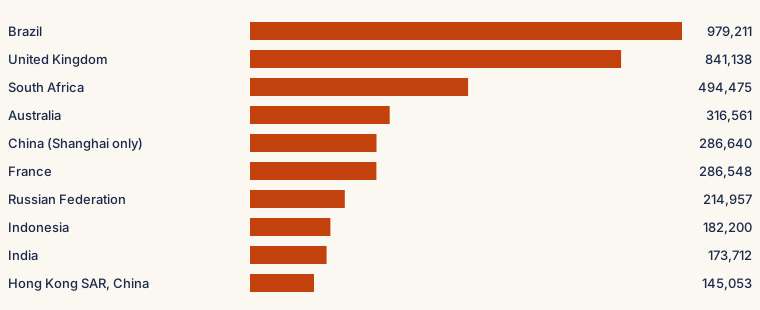
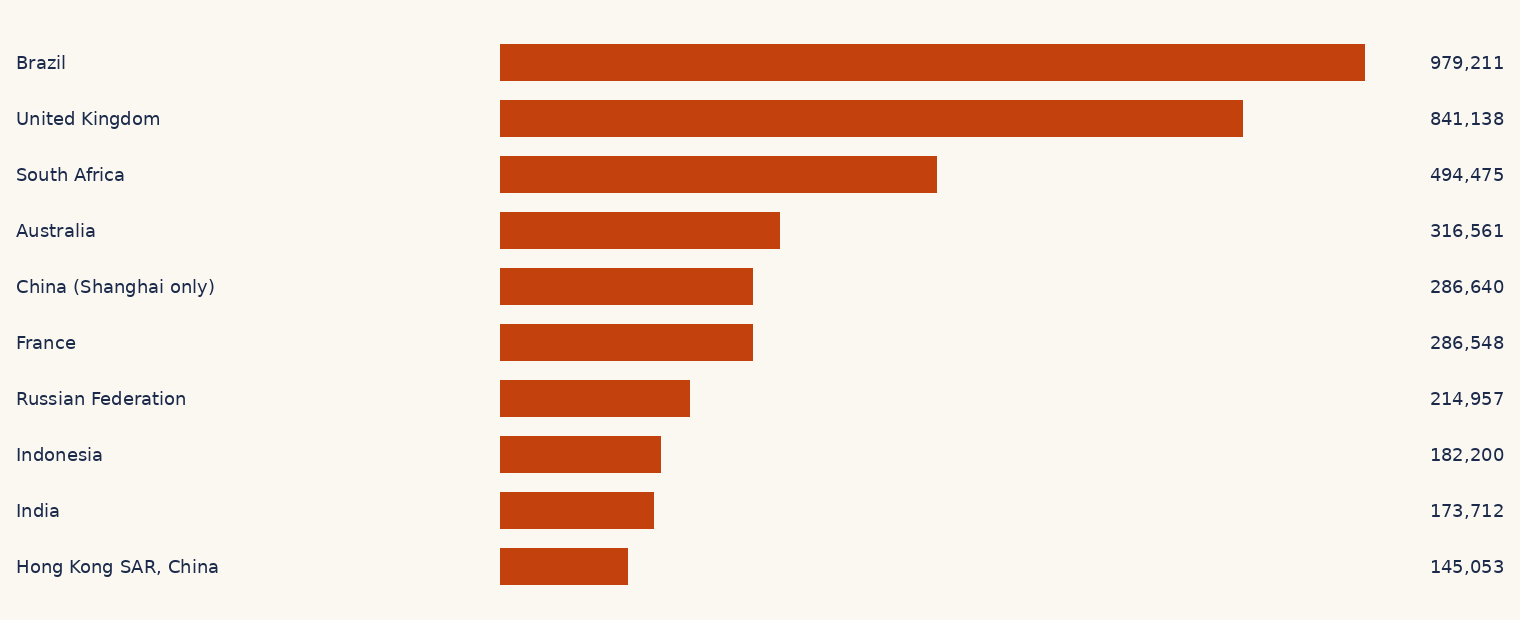
Most 2024 registrations: Brazil, 979,211 new limited-liability firms, density 6.67.
The United States has no density series in this extract. The cell is null, not zero. Nigeria's latest density year in this extract is 2022 (1.12). It is not in the 2024 table. Coverage notes for China, Canada, and the Democratic Republic of Congo stay on the definition page.
| File | Field | Meaning |
|---|---|---|
| wdi-new-business-density-2024.csv | iso3 | ISO3 code from the World Bank country list. |
| wdi-new-business-density-2024.csv | name | World Bank country name. |
| wdi-new-business-density-2024.csv | region | World Bank region name. |
| wdi-new-business-density-2024.csv | income | World Bank income group. |
| wdi-new-business-density-2024.csv | year | Reference year. Every row in this file is 2024. |
| wdi-new-business-density-2024.csv | new_business_density | IC.BUS.NDNS.ZS. New limited-liability firms per 1,000 people ages 15-64. Blank if the World Bank published no value. |
| wdi-new-business-density-2024.csv | new_registrations | IC.BUS.NREG for the same year. Count of new limited-liability firms. Blank if unpublished. |
| wdi-new-business-density-2024.csv | eurostat_offshore_financial_center | true when the economy is on the Eurostat offshore list reproduced in the World Bank methodology note. Otherwise false. |
| wdi-new-business-density-2024.csv | coverage_note | World Bank coverage limit for this economy, or blank. |
| wdi-new-business-density-2024.csv | rank_density_2024 | entrpr rank of 2024 density. 1 is the highest published value. Not a World Bank rank. |
| wdi-new-business-density-latest.csv | iso3 | ISO3 code from the World Bank country list. |
| wdi-new-business-density-latest.csv | name | World Bank country name. |
| wdi-new-business-density-latest.csv | region | World Bank region name. |
| wdi-new-business-density-latest.csv | income | World Bank income group. |
| wdi-new-business-density-latest.csv | year | Latest year with a density value, or blank when the economy has no density series. |
| wdi-new-business-density-latest.csv | new_business_density | Density for that latest year, or blank. Blank is not zero. |
| wdi-new-business-density-latest.csv | new_registrations | Registrations for that same year when published, otherwise blank. |
| wdi-new-business-density-latest.csv | eurostat_offshore_financial_center | true or false, same rule as the 2024 file. |
| wdi-new-business-density-latest.csv | coverage_note | World Bank coverage limit, or blank. |
| wdi-new-business-density-panel.csv | iso3 | ISO3 code. |
| wdi-new-business-density-panel.csv | name | World Bank country name. |
| wdi-new-business-density-panel.csv | region | World Bank region name. |
| wdi-new-business-density-panel.csv | income | World Bank income group. |
| wdi-new-business-density-panel.csv | year | Calendar year of this observation. |
| wdi-new-business-density-panel.csv | new_business_density | IC.BUS.NDNS.ZS for that year, or blank. |
| wdi-new-business-density-panel.csv | new_registrations | IC.BUS.NREG for that year, or blank. |
| wdi-regional-medians-2024.csv | region | World Bank region name. |
| wdi-regional-medians-2024.csv | reference_year | 2024. Regions with no 2024 density value are omitted. |
| wdi-regional-medians-2024.csv | economies_with_density | Economies in the region with a 2024 density value, including offshore centers. |
| wdi-regional-medians-2024.csv | economies_excluding_offshore_centers | That count after Eurostat offshore financial centers are removed. |
| wdi-regional-medians-2024.csv | median_density_excluding_offshore_centers | Median of the remaining 2024 density values, or blank when none remain. |
| wdi-regional-medians-2024.csv | included_in_regional_comparison | true when at least 10 economies remain after the offshore exclusion. Those rows are the regional chart. |
| wdi-regional-medians-2024.csv | sample_note | How to read the median for this region. |
| wdi-panel-median-2006-2024.csv | year | Calendar year from 2006 through 2024. |
| wdi-panel-median-2006-2024.csv | economies | Economies in the fixed panel. The count does not change with the year. |
| wdi-panel-median-2006-2024.csv | median_new_business_density | Median density that year on the fixed panel, offshore centers removed. |
Unit: new limited-liability firms per 1,000 people ages 15-64 in a calendar year (IC.BUS.NDNS.ZS). The registration column is the count of those firms (IC.BUS.NREG), not divided by population. entrpr stores the World Bank value after Python round, half to even: 2 decimal places for density, a whole number for registrations. Missing stays missing.
The 2024 file keeps one reference year. The latest-year file uses each economy's newest density year, and it includes a blank row when an economy has neither series. The panel file is every published economy-year in the extract. Offshore financial centers stay in those files because the World Bank publishes them. They are removed only for the regional comparison and the fixed-panel median, which is the World Bank's own trend rule, using the Eurostat list in the methodology note.
A region is in the comparison chart when at least 10 economies remain after that exclusion. The fixed panel keeps economies observed every year from 2006 through 2024, then drops offshore centers. It is not a world median. Full wording, the formula, and the source links are on the definition methods and the methodology page.
The 6 November 2026 API comparison applied to extract 2026-07-01. This page is built from extract 2026-11-06, so that comparison is not restated as current.
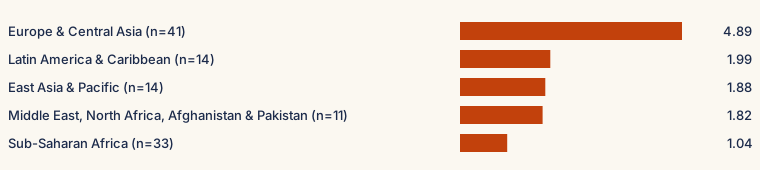
World Bank region names, 2024 only. There is no separate Europe, Africa, or Asia file. Those labels do not match these regions. The chart includes only rows marked true in the comparison column. The table is the full file, including regions that are too small for that comparison.
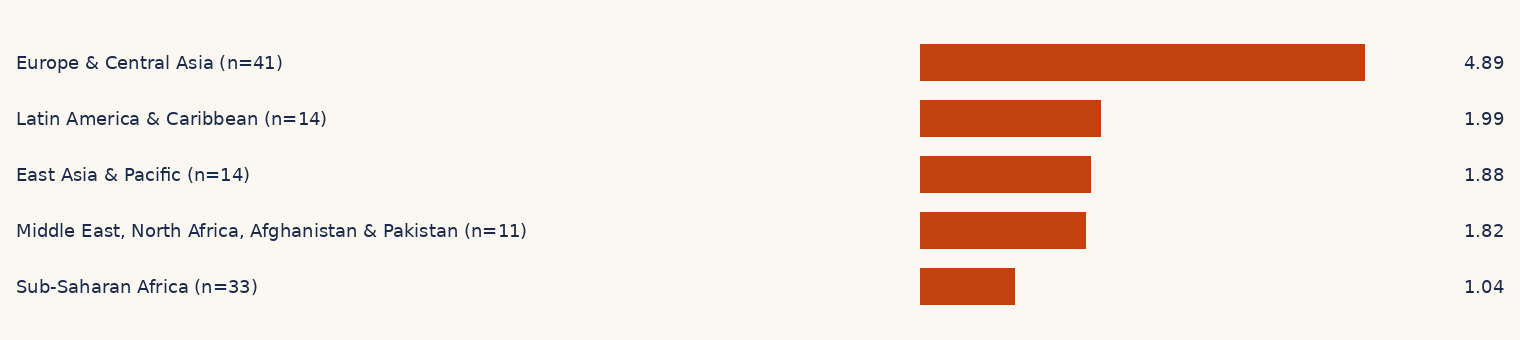
SVG viewBox 760 by 170. PNG is 1520 by 340 pixels. The table below is the text alternative for the file, not only for the bars.
| region | reference_year | economies_with_density | economies_excluding_offshore_centers | median_density_excluding_offshore_centers | included_in_regional_comparison | sample_note |
|---|---|---|---|---|---|---|
| Europe & Central Asia | 2024 | 43 | 41 | 4.89 | true | 2024 new business density only. Median excludes Eurostat offshore financial centers. Included in the regional comparison because at least 10 economies remain. |
| Latin America & Caribbean | 2024 | 23 | 14 | 1.99 | true | 2024 new business density only. Median excludes Eurostat offshore financial centers. Included in the regional comparison because at least 10 economies remain. |
| East Asia & Pacific | 2024 | 18 | 14 | 1.88 | true | 2024 new business density only. Median excludes Eurostat offshore financial centers. Included in the regional comparison because at least 10 economies remain. |
| Middle East, North Africa, Afghanistan & Pakistan | 2024 | 12 | 11 | 1.82 | true | 2024 new business density only. Median excludes Eurostat offshore financial centers. Included in the regional comparison because at least 10 economies remain. |
| Sub-Saharan Africa | 2024 | 36 | 33 | 1.04 | true | 2024 new business density only. Median excludes Eurostat offshore financial centers. Included in the regional comparison because at least 10 economies remain. |
| South Asia | 2024 | 2 | 2 | 0.12 | false | 2024 new business density only. Median excludes Eurostat offshore financial centers. Not included in the regional comparison because fewer than 10 economies remain. |
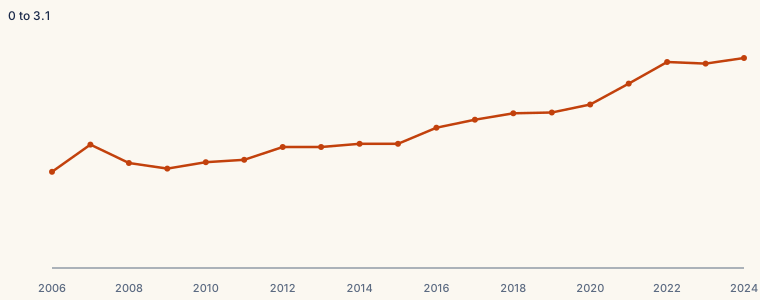
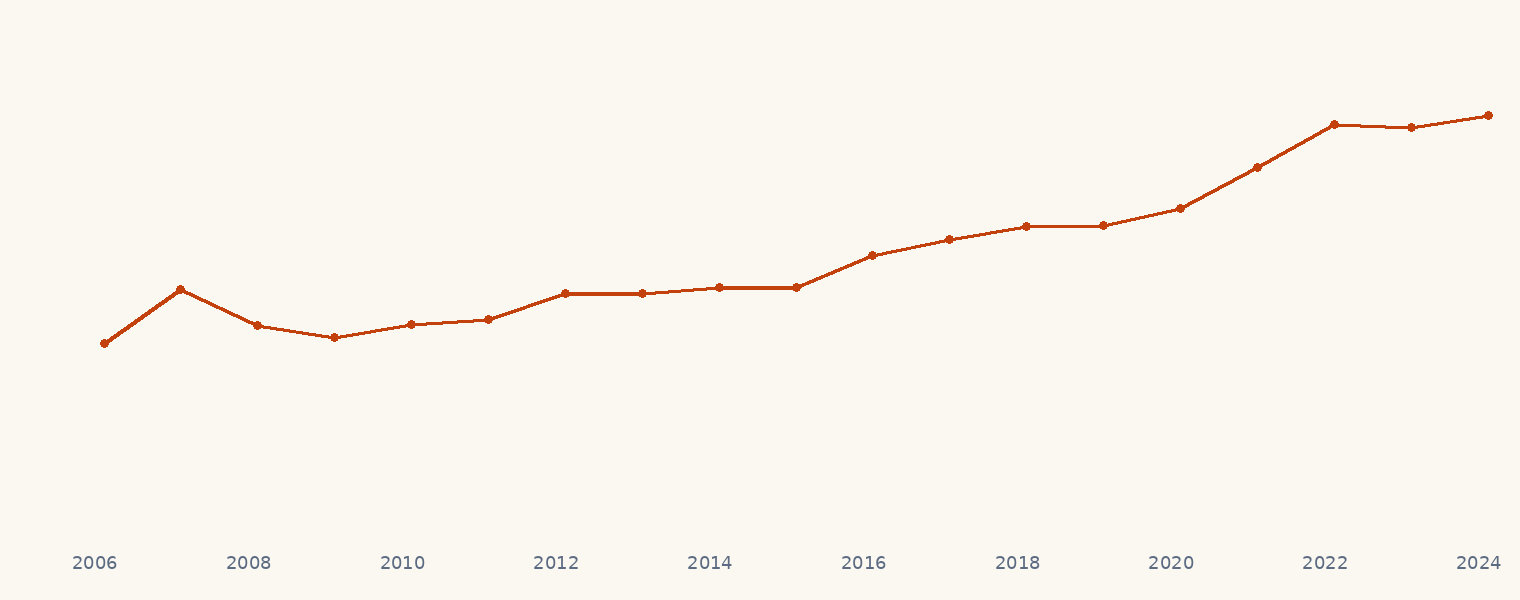
Fixed set of economies with a new business density value in every year from 2006 through 2024, after Eurostat offshore financial centers are removed. Not a median of every economy. The panel has 85 economies. The median is 1.20 in 2006 and 2.62 in 2024.
| year | economies | median_new_business_density |
|---|---|---|
| 2006 | 85 | 1.20 |
| 2007 | 85 | 1.54 |
| 2008 | 85 | 1.31 |
| 2009 | 85 | 1.24 |
| 2010 | 85 | 1.32 |
| 2011 | 85 | 1.35 |
| 2012 | 85 | 1.51 |
| 2013 | 85 | 1.51 |
| 2014 | 85 | 1.55 |
| 2015 | 85 | 1.55 |
| 2016 | 85 | 1.75 |
| 2017 | 85 | 1.85 |
| 2018 | 85 | 1.93 |
| 2019 | 85 | 1.94 |
| 2020 | 85 | 2.04 |
| 2021 | 85 | 2.30 |
| 2022 | 85 | 2.57 |
| 2023 | 85 | 2.55 |
| 2024 | 85 | 2.62 |
Download the panel median CSV. Economy-level history is the full panel, not this median.
Charts are static files generated with the site. Nothing is drawn in the visitor's browser from a third party. Each PNG is twice the SVG viewBox, in pixels.
| Chart | SVG | PNG | Download | Table |
|---|---|---|---|---|
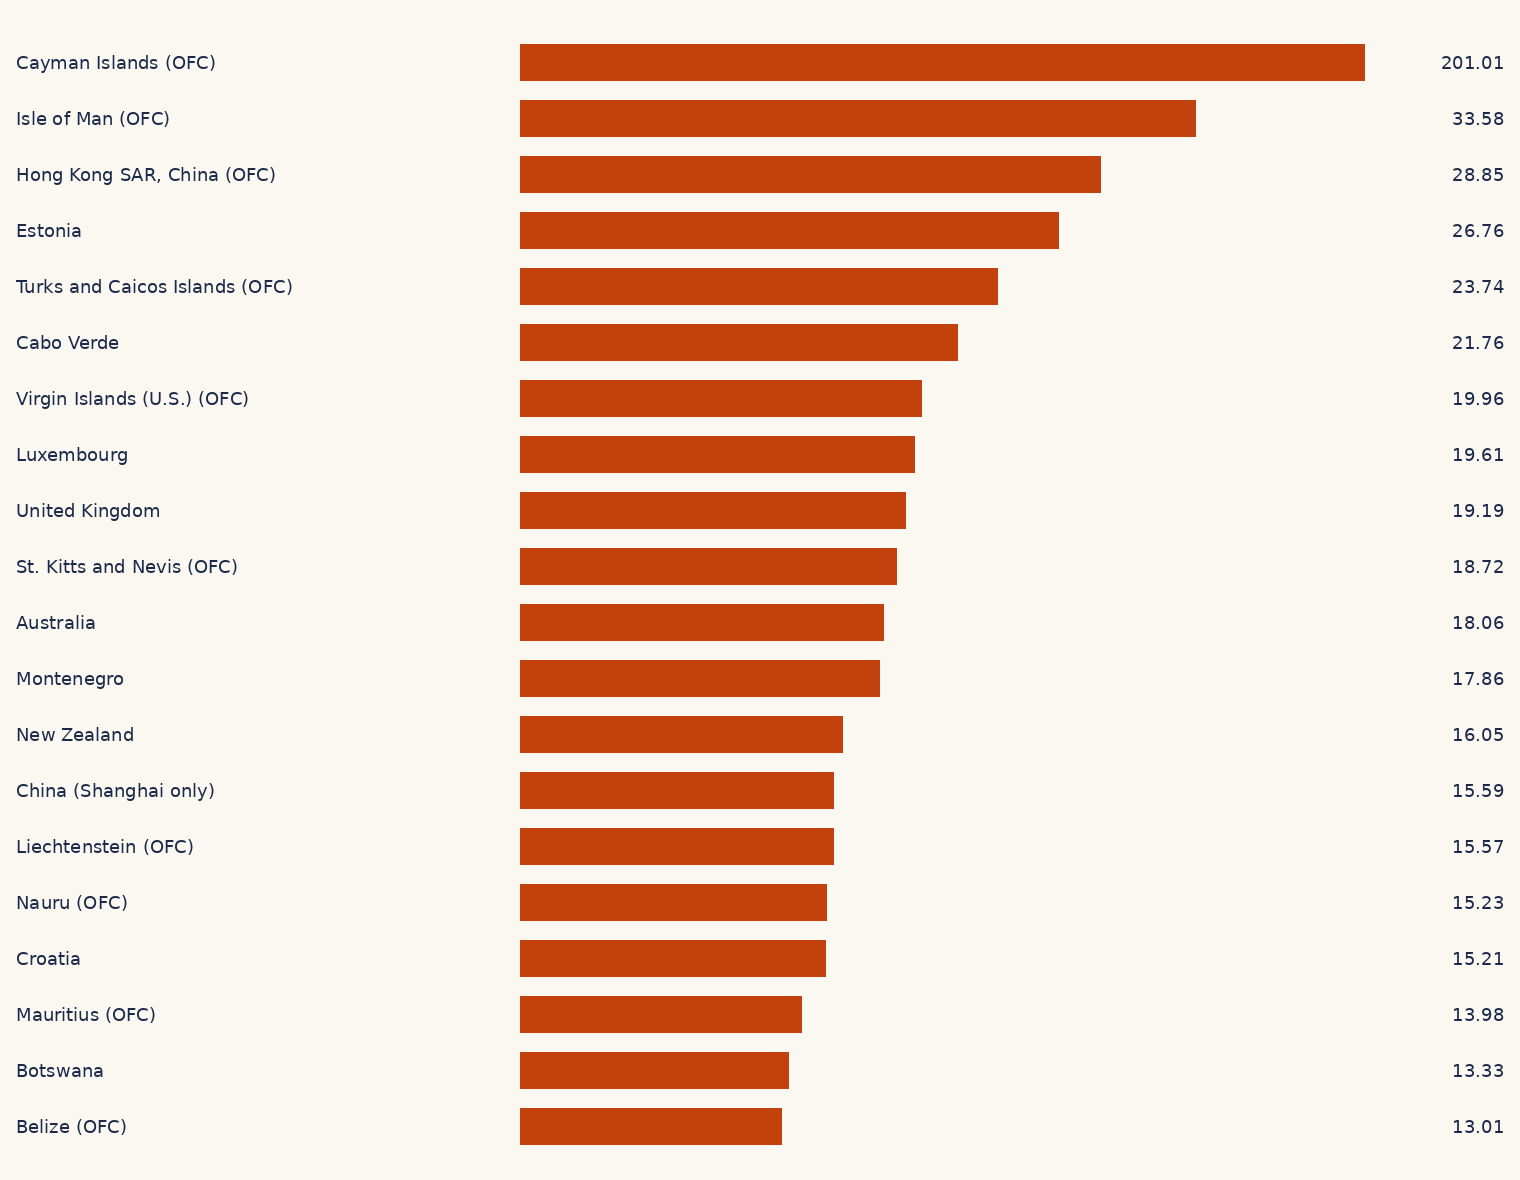
| Top 20 new business density, 2024 | 760 by 590 | 1520 by 1180 | SVG · PNG | Table |
| Most new limited-liability registrations, 2024 | 760 by 310 | 1520 by 620 | SVG · PNG | Table |
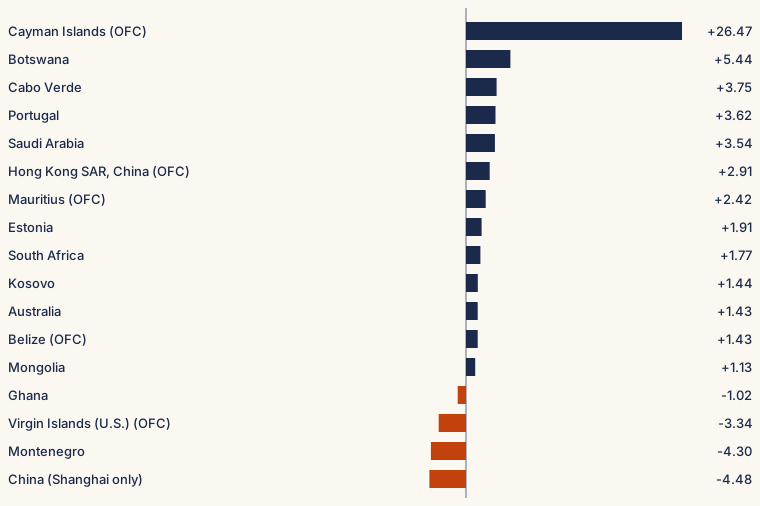
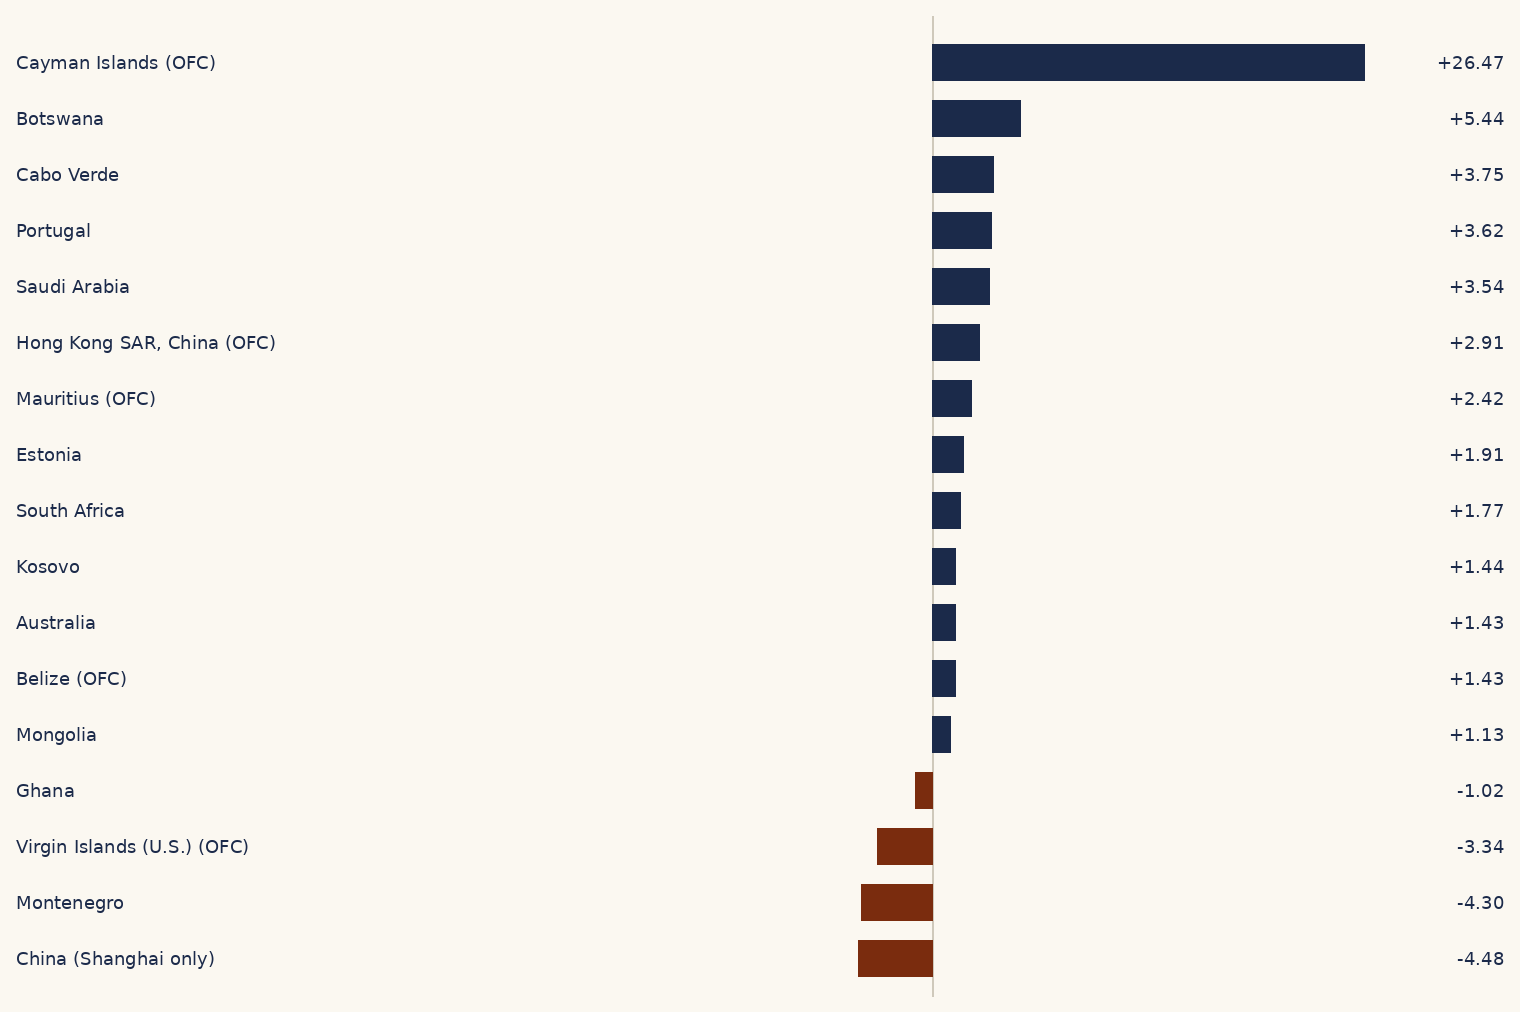
| New business density change, 2023 to 2024 | 760 by 506 | 1520 by 1012 | SVG · PNG | Table |
| Regional median new business density, 2024 | 760 by 170 | 1520 by 340 | SVG · PNG | Table |
| Median new business density, 2006 to 2024 | 760 by 300 | 1520 by 600 | SVG · PNG | Table |
The snippet loads one HTML file from entrpr. It includes the chart and the table. It does not load a script. If the frame cannot be displayed, the same table is on this page.
Source credit inside the frame points here. It is optional to keep that link. It is not a condition written into the data license beyond CC BY 4.0 attribution for the World Bank observations.
The version in the citation is the generated date in site/data/countries.json. These file addresses do not change. A later extract overwrites them. Older extracts are not kept as separate public copies.
To report a possible error, use the form on the data page. Check the cited World Bank series and year first. entrpr does not run a separate corrections inbox on this page.
How to update the version note when the extract changes is in docs/data-library.md in the site repository.