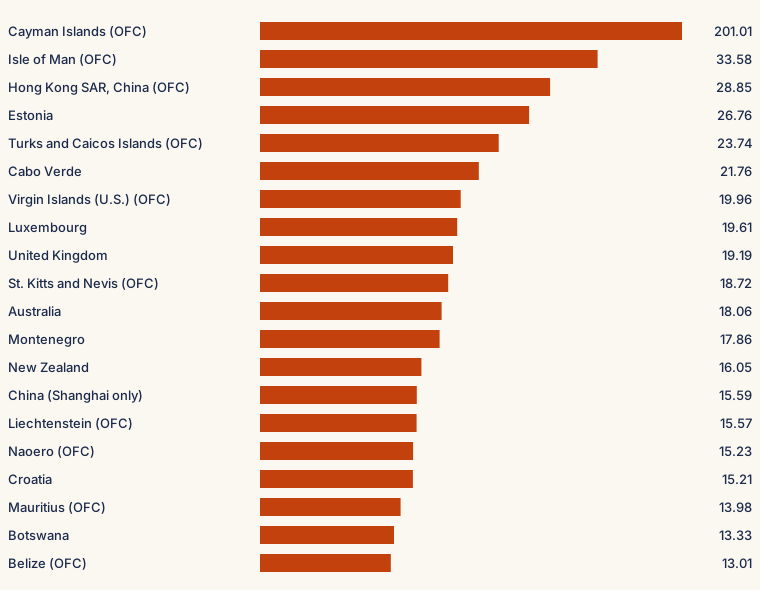
In 2024, 134 economies have a World Bank new business density value. The median is 2.61 new limited-liability firms per 1,000 people ages 15-64. The highest published value is Cayman Islands at 201.01. Brazil has the most new registrations, 979,211. These are not rankings of the most entrepreneurial countries. Five findings follow, each tied to a table you can download.
Erik Rostad, owner of entrpr. Last updated 6 November 2026. Data extract 1 July 2026. World Bank API metadata for these series said last updated 8 October 2026 when the 2024 values were compared with this extract on 6 November 2026. Report a correction.
The top of a new business density table is easy to misread as a league table of entrepreneurship. It is not. Density divides registrations by people ages 15-64, so a small population with a busy registry ranks above a much larger economy. In 2024 the highest published value is Cayman Islands at 201.01. 10 of the top 20 economies are on the Eurostat offshore financial center list. The World Bank publishes those figures and, in its own trend work, sets them aside because the registrations can include shell companies with no local economic activity. Outside that list, Estonia has the highest 2024 density, at 26.76 (rank 4 of 134 published values). That is a statement about this indicator and this year. It is not a claim that Estonia is the best place to start a business.
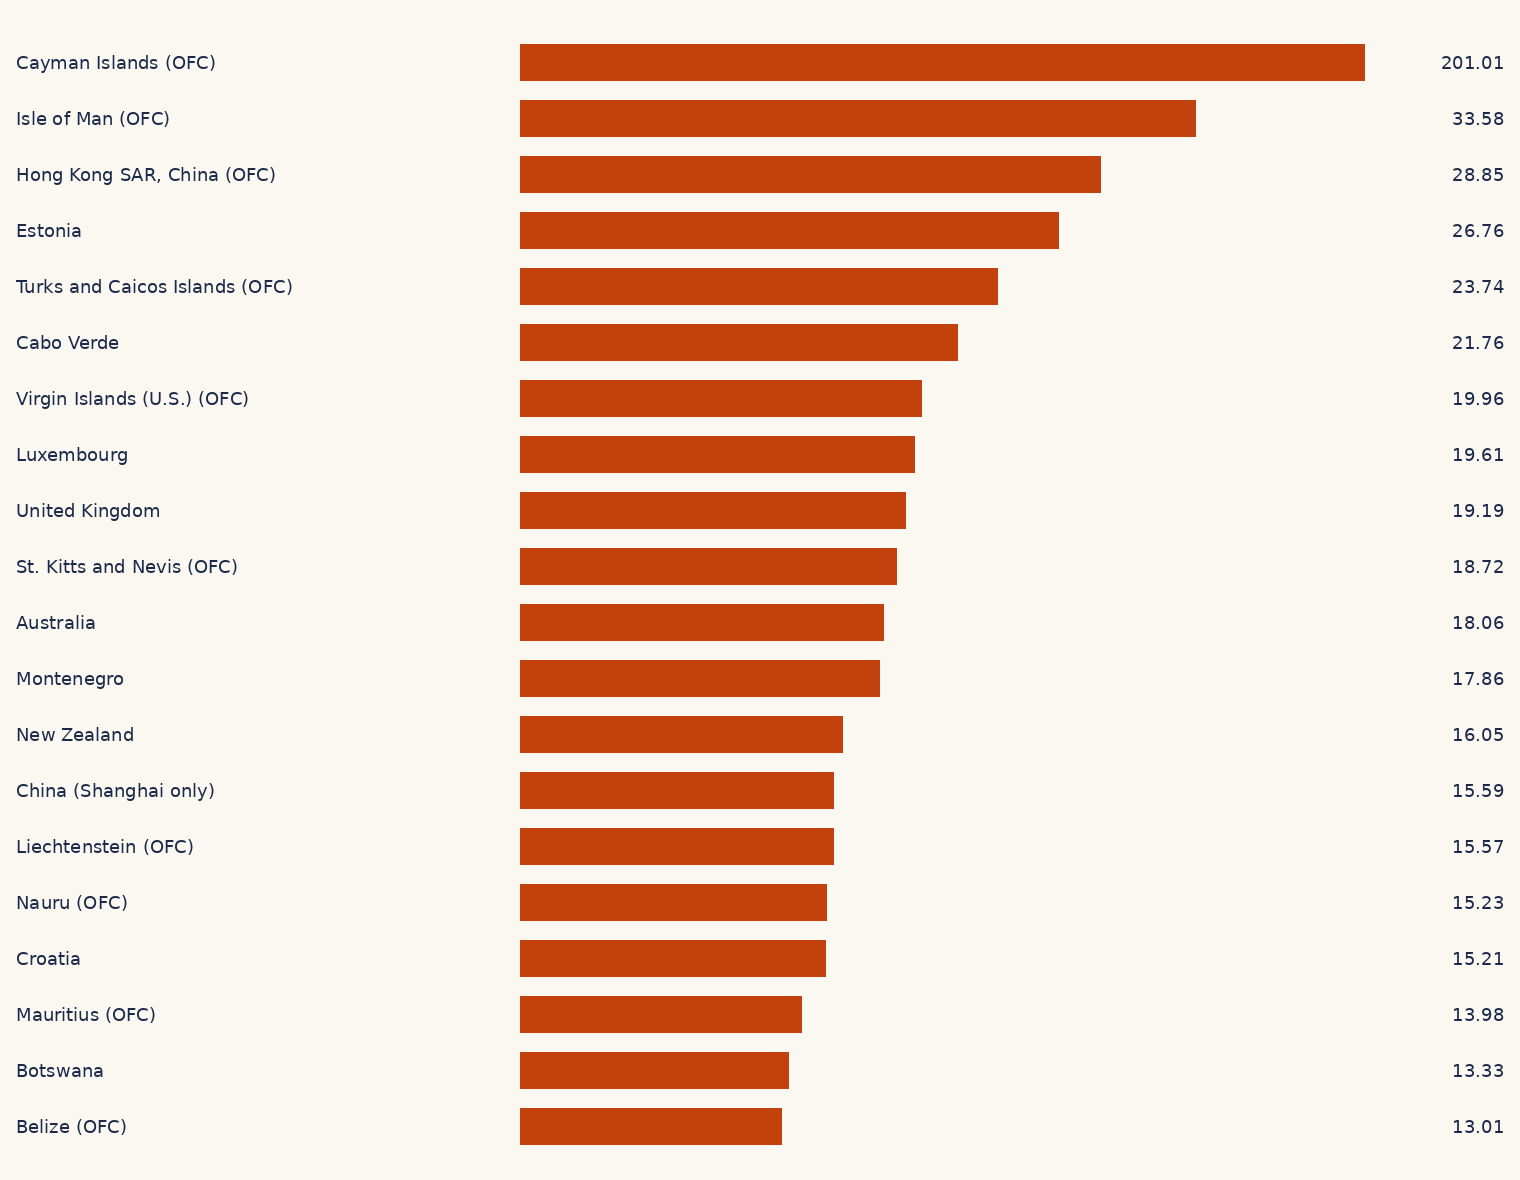
Bar chart of the 20 highest 2024 new business density values. The axis is capped at 41.97 so shorter bars stay readable. Printed numbers are the actual values. OFC marks Eurostat offshore financial centers. Source: World Bank, World Development Indicators, IC.BUS.NDNS.ZS, 2024. Extract 1 July 2026.
The full 134-row 2024 table is on the new business density page. OFC means the economy is on the Eurostat list that the World Bank excludes from trend analysis.
2. Counts and density do not pick the same countries
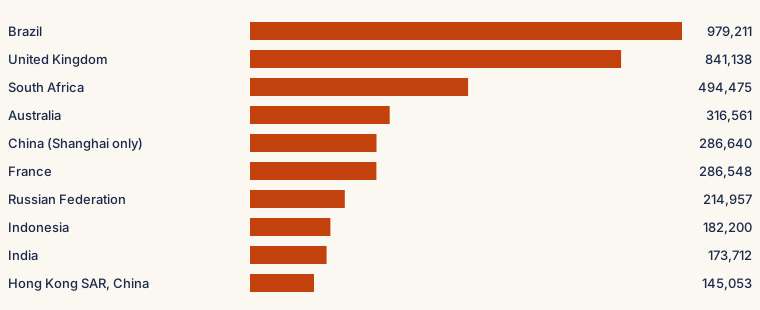
Registration counts answer a different question: where the largest number of new limited-liability companies was recorded. In 2024 that is Brazil, with 979,211 registrations and a density of 6.67. India recorded 173,712 registrations and a density of 0.18, so it sits near the top of the count list and near the bottom of the density list. The United Kingdom is high on both: density 19.19 (rank 9 of 134) and 841,138 registrations. The published China figures are 286,640 registrations and density 15.59. The World Bank says the China series includes Shanghai only, so this is not a national figure.
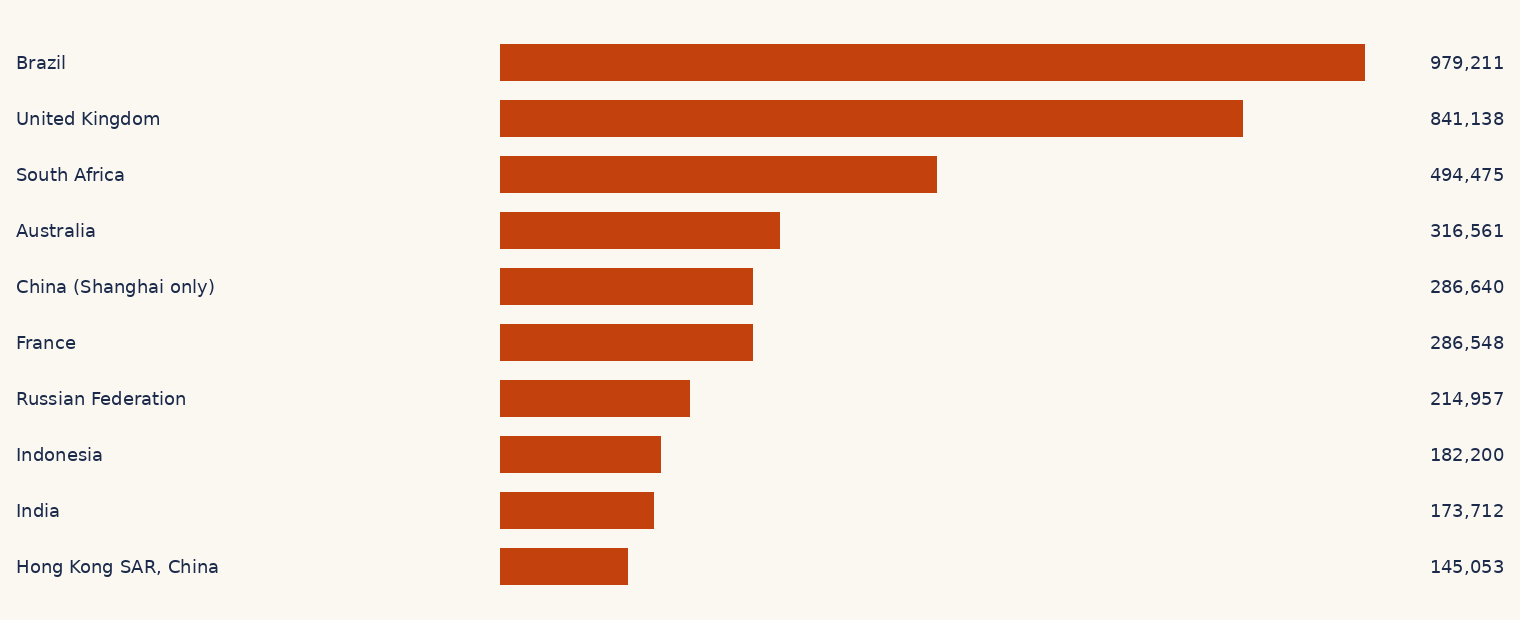
Ten highest 2024 values of new businesses registered (IC.BUS.NREG). This is a count, not density. Source: World Bank, World Development Indicators, IC.BUS.NREG, 2024. Extract 1 July 2026.
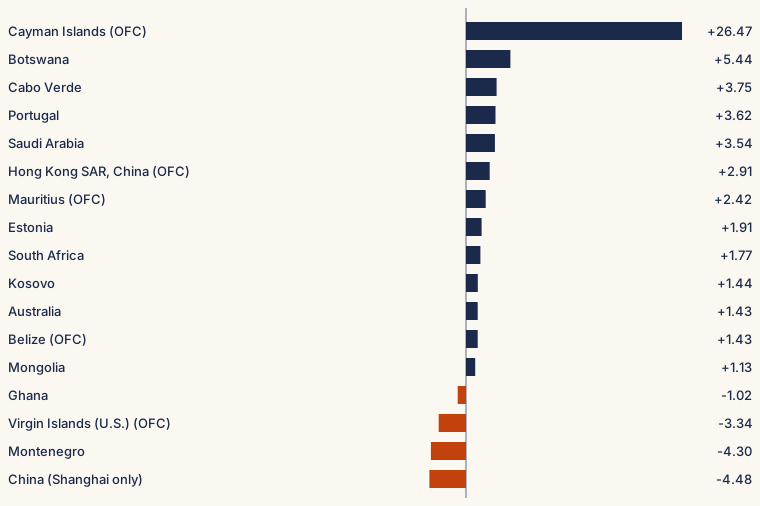
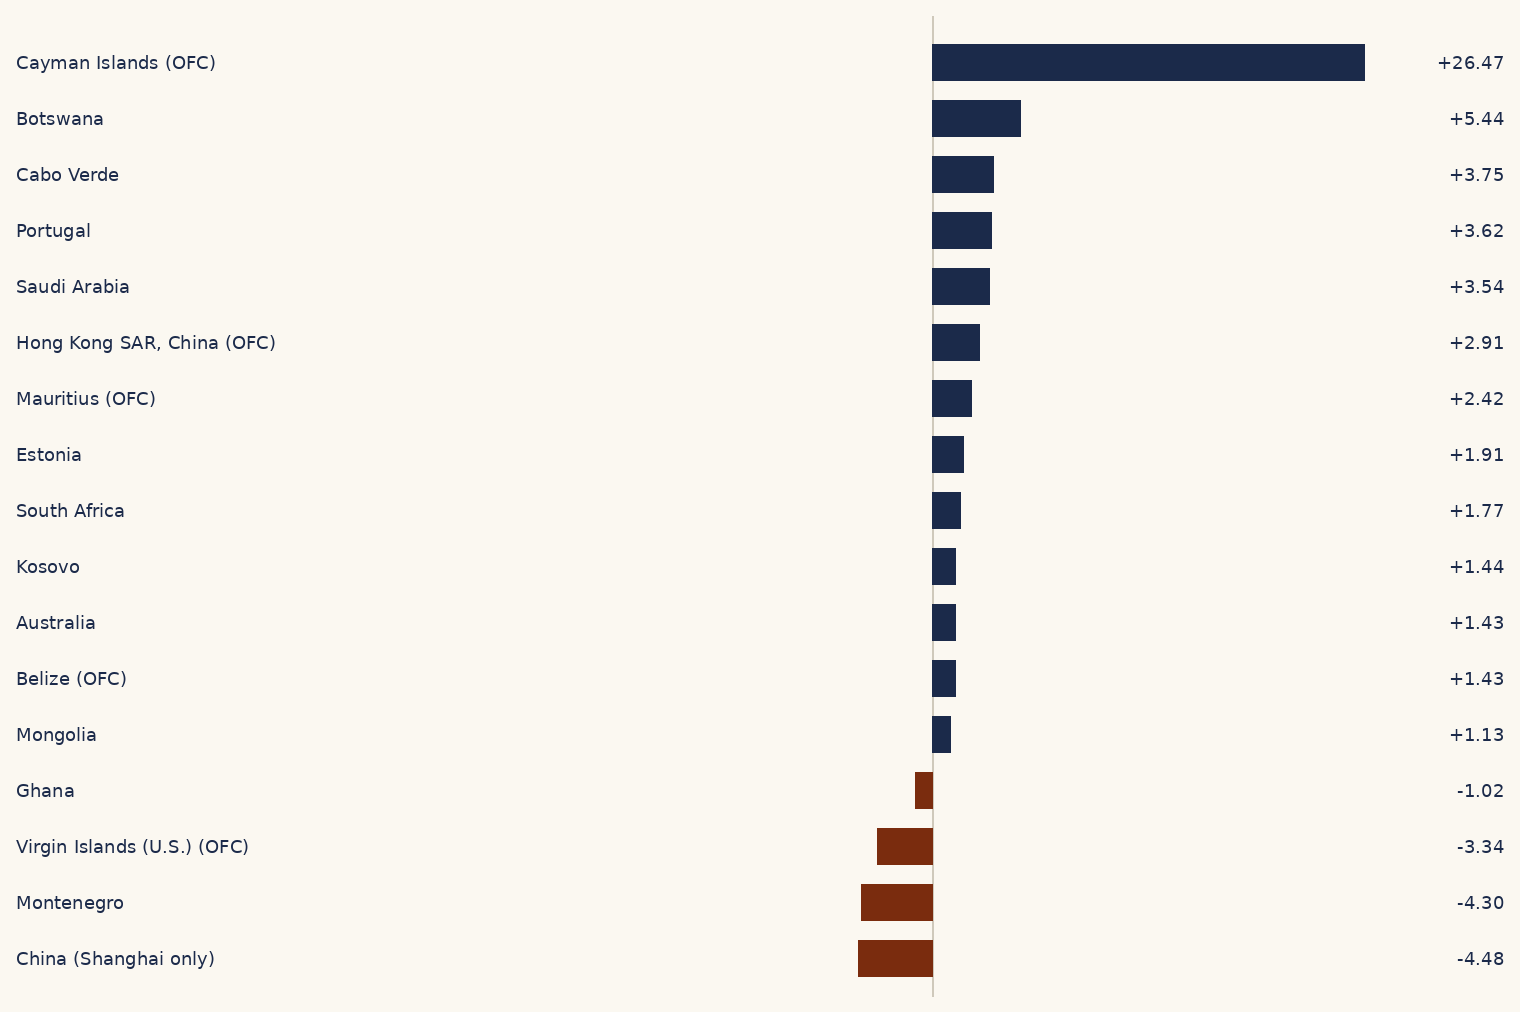
A density jump on a tiny registry is mostly arithmetic. A move from 2023 to 2024 is listed as notable only when 2023 registrations were at least 1,000 and the density change was at least 1.0 per 1,000. 17 economies meet that rule. The largest increase is Cayman Islands, from 174.54 to 201.01 (+26.47). This economy is on the Eurostat offshore financial center list. The largest increase outside the offshore list is Botswana, from 7.89 to 13.33 (+5.44). The largest decrease under the same rule is China, from 20.07 to 15.59 (-4.48). The World Bank says the China series includes Shanghai only, so this is not a national figure. 5 other economies moved by 1.0 or more but stayed under the 1,000 registration floor: Naoero, St. Kitts and Nevis, Turks and Caicos Islands, St. Lucia, Seychelles. They are listed so the floor is visible. These are changes in the published series. This report does not identify a legal or economic cause.
Density change for economies with at least 1,000 registrations in 2023 and an absolute density change of at least 1.0. Source: entrpr calculation from World Bank IC.BUS.NDNS.ZS, 2023 and 2024.
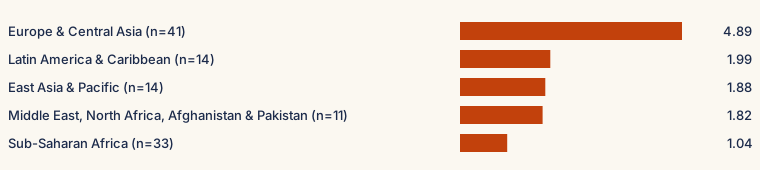
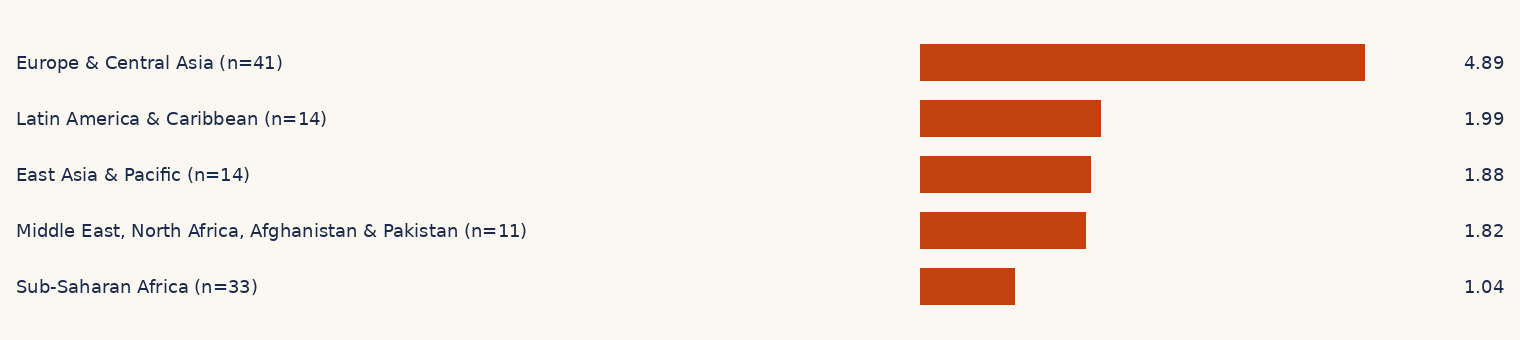
Regional medians use 2024 only. An economy whose latest figure is from another year is left out, not mixed in. Economies on the Eurostat offshore list are left out of the median, matching the World Bank rule for its own analysis. Their values stay in the ranking table. Among regions with at least 10 remaining economies, the highest median is Europe & Central Asia at 4.89 (n=41) and the lowest is Sub-Saharan Africa at 1.04 (n=33). South Asia has 2 economies with a 2024 value (Bangladesh 0.06, India 0.18), which is too few for that comparison. North America has no 2024 density in this extract. The United States is not in the series. Canada's latest density in this extract is 5.17 in 2022. The World Bank says the Canada series covers federal registrations, Quebec, and Nova Scotia only.
There is no separate Europe, Africa, or Asia URL. World Bank regions do not match those labels: Europe and Central Asia includes Central Asia, North Africa sits outside Sub-Saharan Africa, and Asia is split across more than one region. Medians below use the World Bank region name, 2024 only, and at least 10 economies after the offshore exclusion.
Median new business density in 2024 by World Bank region, excluding Eurostat offshore financial centers, for regions with at least 10 remaining economies. Axis starts at zero. Source: entrpr median of World Bank IC.BUS.NDNS.ZS, 2024, offshore centers excluded.
South Asia: 2 economies in 2024 after the offshore exclusion, too few for a median comparison
This region does not reach 10 economies with a 2024 value once offshore centers are set aside (n=2). The values are listed and are not summarized as a median.
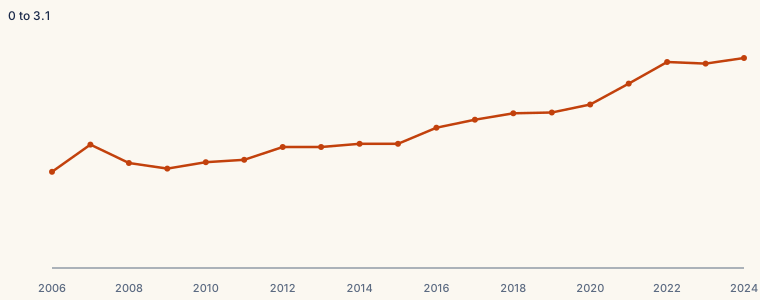
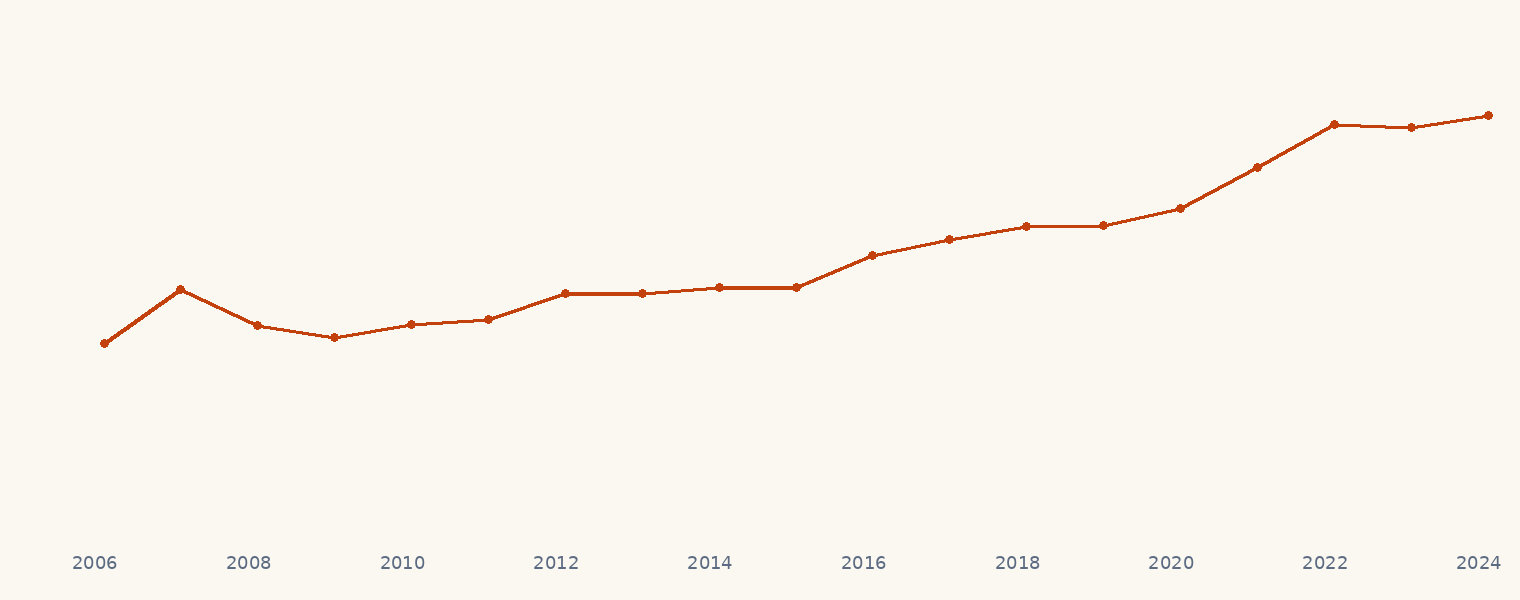
A line that uses whoever reported each year will move because the sample changes. The line here does not. 97 economies have a density value in every year from 2006 through 2024. 12 of them are on the offshore list and are removed, leaving 85. The median of that fixed group was 1.20 in 2006 and 2.62 in 2024. It still fell in 3 year-to-year steps: 2007 to 2008 (1.54 to 1.31), 2008 to 2009 (1.31 to 1.24), 2022 to 2023 (2.57 to 2.55). The number of economies with any density value peaked at 173 in 2018 and was 134 in 2024. 34 economies in the country list have no density series at all, and 49 have some data but not for 2024. The panel says nothing about them. It is a description of one complete group, not a world trend, and it is not a World Bank official trend.
Median new business density each year for the 85 economies observed in every year from 2006 through 2024, excluding Eurostat offshore financial centers. The axis starts at zero. Source: entrpr median of a fixed panel from World Bank IC.BUS.NDNS.ZS, 2006 to 2024.
Balanced panel median by year, offshore centers excluded
Year
Economies
Median density
2006
85
1.20
2007
85
1.54
2008
85
1.31
2009
85
1.24
2010
85
1.32
2011
85
1.35
2012
85
1.51
2013
85
1.51
2014
85
1.55
2015
85
1.55
2016
85
1.75
2017
85
1.85
2018
85
1.93
2019
85
1.94
2020
85
2.04
2021
85
2.30
2022
85
2.57
2023
85
2.55
2024
85
2.62
Coverage and limits
WDI publishes a value only when the Entrepreneurship Database has one. 34 economies in the country file have neither series, including the United States. 49 have density for an earlier year only. Nigeria's latest density is 2022, so Nigeria is not in the 2024 tables. China's published figures follow the World Bank coverage note, not a national total. The same is true for Canada and the Democratic Republic of Congo where those rows appear.
How many economies report new business density each year
Year
Economies with a density value
2006
130
2007
132
2008
141
2009
147
2010
146
2011
150
2012
153
2013
160
2014
164
2015
166
2016
169
2017
171
2018
173
2019
165
2020
166
2021
150
2022
154
2023
140
2024
134
Offshore financial centers
Annex 2 of the World Bank methodology note reproduces the Eurostat list and says those economies are excluded from trend analysis because registrations may be shell companies. This report follows that rule for the regional medians and the 2006 to 2024 panel. The 2024 ranking still shows them, marked OFC, because hiding published values would be a different distortion. The list of 2024 values is on the definition page.
Methods
Extract: site/data/countries.json, generated 1 July 2026. Indicator metadata lastupdated 2026-10-08, checked 2026-11-06. The 2024 cross-section matched for IC.BUS.NDNS.ZS and IC.BUS.NREG.
Rounding: half to even, 2 decimal places for density, whole numbers for registrations. Null is never replaced with zero.
One-year filter: both 2023 and 2024 density present, 2023 registrations at least 1,000, absolute density change at least 1.0.
Regional median: 2024 only, World Bank region, Eurostat offshore centers removed, region kept when at least 10 economies remain. Even counts use the average of the two middle values.
Panel: economies with a density value in every year 2006 through 2024, then offshore centers removed. The median is recomputed each year on that fixed set.
entrpr calculated the ranks, medians, changes, and panel. The World Bank calculated the underlying indicator.
Coverage notes
World Bank Entrepreneurship Database: for China, only the data for Shanghai is included. The methodology note lists the Ministry of Finance (Beijing) and the Shanghai Administration of Industry and Commerce as sources. The published figure is not a complete national series. Source: World Bank Entrepreneurship Database.
World Bank Entrepreneurship Database: data for the Democratic Republic of Congo cover Kinshasa, Kongo Central, Upper Katanga, Tshopo, North Kivu, South Kivu, Lualaba, Eastern Kasai, and Central Kasai only. Source: World Bank Entrepreneurship Database.
World Bank Entrepreneurship Database: data for Canada cover federal registrations, Quebec, and Nova Scotia only. Source: World Bank Entrepreneurship Database.
World Bank, World Development Indicators, IC.BUS.NREG, New businesses registered (number). Source note: the number of new limited liability corporations (or its equivalent) registered in the calendar year.