New business density is the number of newly registered limited-liability firms per 1,000 people ages 15-64 in a calendar year. The World Bank publishes it as IC.BUS.NDNS.ZS. It counts formal limited-liability companies of any size. It leaves out sole proprietors and informal businesses, and it is not the Global Entrepreneurship Monitor TEA rate. In this extract, 134 economies have a 2024 value. The median is 2.61. A blank means not reported. It does not mean zero.
Use this page for the definition, the formula, the 2024 ranking, and the download. The entrepreneurship rate by country page explains why this is not the only measure. The 2024 findings add the comparisons.
New business density = newly registered limited-liability firms in the calendar year, divided by people ages 15-64, multiplied by 1,000.
The unit is firms per 1,000 people ages 15-64. entrpr does not recompute that quotient. The numbers below are the World Bank indicator, after the rounding described in methods.
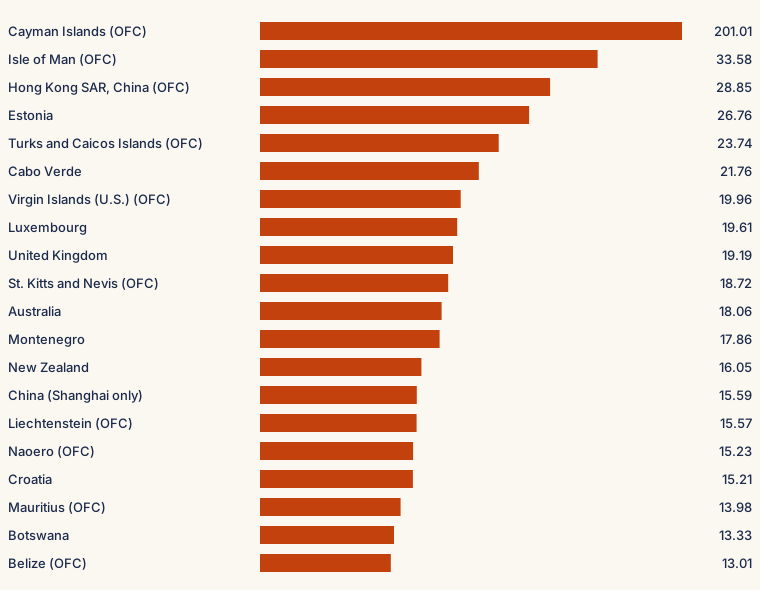
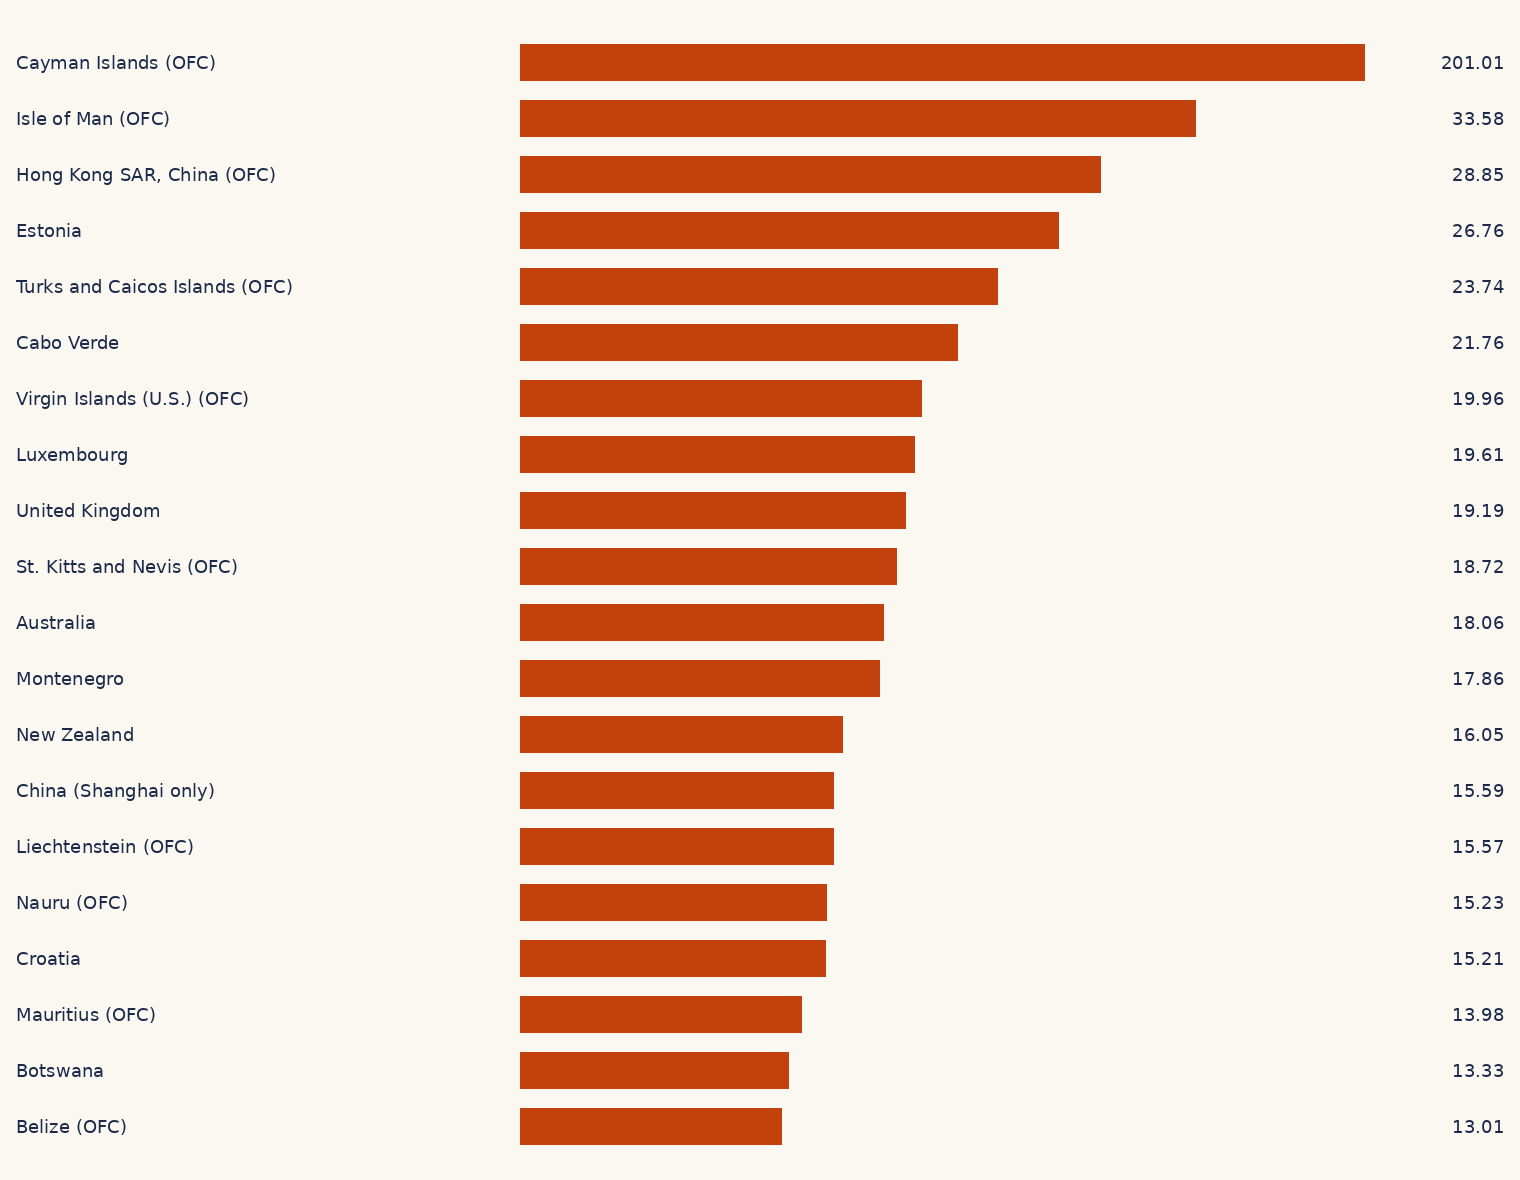
This table keeps a single reference year. 134 economies have a 2024 value. The median is 2.61. Offshore financial centers stay in this table because the World Bank publishes them in WDI. They are marked OFC. 10 of the top 20 carry that mark. Outside the list, Estonia is highest, at 26.76.
| Rank | Economy | World Bank region | Year | New business density | New registrations |
|---|---|---|---|---|---|
| 1 | Cayman Islands OFC | Latin America & Caribbean | 2024 | 201.01 | 11,197 |
| 2 | Isle of Man OFC | Europe & Central Asia | 2024 | 33.58 | 1,770 |
| 3 | Hong Kong SAR, China OFC | East Asia & Pacific | 2024 | 28.85 | 145,053 |
| 4 | Estonia | Europe & Central Asia | 2024 | 26.76 | 23,154 |
| 5 | Turks and Caicos Islands OFC | Latin America & Caribbean | 2024 | 23.74 | 803 |
| 6 | Cabo Verde | Sub-Saharan Africa | 2024 | 21.76 | 7,719 |
| 7 | Virgin Islands (U.S.) OFC | Latin America & Caribbean | 2024 | 19.96 | 1,267 |
| 8 | Luxembourg | Europe & Central Asia | 2024 | 19.61 | 9,137 |
| 9 | United Kingdom | Europe & Central Asia | 2024 | 19.19 | 841,138 |
| 10 | St. Kitts and Nevis OFC | Latin America & Caribbean | 2024 | 18.72 | 619 |
| 11 | Australia | East Asia & Pacific | 2024 | 18.06 | 316,561 |
| 12 | Montenegro | Europe & Central Asia | 2024 | 17.86 | 7,136 |
| 13 | New Zealand | East Asia & Pacific | 2024 | 16.05 | 55,417 |
| 14 | China coverage note | East Asia & Pacific | 2024 | 15.59 | 286,640 |
| 15 | Liechtenstein OFC | Europe & Central Asia | 2024 | 15.57 | 407 |
| 16 | Naoero OFC | East Asia & Pacific | 2024 | 15.23 | 108 |
| 17 | Croatia | Europe & Central Asia | 2024 | 15.21 | 14,324 |
| 18 | Mauritius OFC | Sub-Saharan Africa | 2024 | 13.98 | 12,614 |
| 19 | Botswana | Sub-Saharan Africa | 2024 | 13.33 | 21,456 |
| 20 | Belize OFC | Latin America & Caribbean | 2024 | 13.01 | 3,710 |
| 21 | Singapore OFC | East Asia & Pacific | 2024 | 11.59 | 52,248 |
| 22 | South Africa | Sub-Saharan Africa | 2024 | 11.46 | 494,475 |
| 23 | Portugal | Europe & Central Asia | 2024 | 11.00 | 73,740 |
| 24 | Iceland | Europe & Central Asia | 2024 | 10.86 | 2,925 |
| 25 | Bulgaria | Europe & Central Asia | 2024 | 10.46 | 42,783 |
| 26 | Malta | Middle East, North Africa, Afghanistan & Pakistan | 2024 | 8.47 | 3,247 |
| 27 | Kosovo | Europe & Central Asia | 2024 | 8.35 | 8,824 |
| 28 | Norway | Europe & Central Asia | 2024 | 8.32 | 30,147 |
| 29 | Cote d'Ivoire | Sub-Saharan Africa | 2024 | 8.28 | 20,143 |
| 30 | Mongolia | East Asia & Pacific | 2024 | 8.26 | 18,238 |
| 31 | Barbados OFC | Latin America & Caribbean | 2024 | 8.11 | 1,517 |
| 32 | Georgia | Europe & Central Asia | 2024 | 7.62 | 17,783 |
| 33 | Romania | Europe & Central Asia | 2024 | 7.47 | 91,649 |
| 34 | Sweden | Europe & Central Asia | 2024 | 7.08 | 46,622 |
| 35 | Latvia | Europe & Central Asia | 2024 | 7.02 | 8,218 |
| 36 | Denmark | Europe & Central Asia | 2024 | 6.85 | 25,969 |
| 37 | France | Europe & Central Asia | 2024 | 6.82 | 286,548 |
| 38 | Namibia | Sub-Saharan Africa | 2024 | 6.74 | 12,117 |
| 39 | Brazil | Latin America & Caribbean | 2024 | 6.67 | 979,211 |
| 40 | Ireland | Europe & Central Asia | 2024 | 6.65 | 23,440 |
| 41 | Costa Rica | Latin America & Caribbean | 2024 | 6.31 | 22,333 |
| 42 | Bahrain OFC | Middle East, North Africa, Afghanistan & Pakistan | 2024 | 6.16 | 7,580 |
| 43 | Finland | Europe & Central Asia | 2024 | 5.97 | 20,690 |
| 44 | Slovak Republic | Europe & Central Asia | 2024 | 5.68 | 20,239 |
| 45 | Saudi Arabia | Middle East, North Africa, Afghanistan & Pakistan | 2024 | 5.46 | 141,067 |
| 46 | North Macedonia | Europe & Central Asia | 2024 | 5.18 | 6,045 |
| 47 | Peru | Latin America & Caribbean | 2024 | 4.90 | 111,997 |
| 48 | Moldova | Europe & Central Asia | 2024 | 4.89 | 7,478 |
| 49 | Eswatini | Sub-Saharan Africa | 2024 | 4.39 | 3,405 |
| 50 | Czechia | Europe & Central Asia | 2024 | 4.31 | 29,877 |
| 51 | Seychelles OFC | Sub-Saharan Africa | 2024 | 4.26 | 370 |
| 52 | Antigua and Barbuda OFC | Latin America & Caribbean | 2024 | 4.16 | 275 |
| 53 | Armenia | Europe & Central Asia | 2024 | 4.12 | 8,381 |
| 54 | Hungary | Europe & Central Asia | 2024 | 3.83 | 23,691 |
| 55 | Dominica OFC | Latin America & Caribbean | 2024 | 3.73 | 171 |
| 56 | Spain | Europe & Central Asia | 2024 | 3.67 | 118,193 |
| 57 | Kazakhstan | Europe & Central Asia | 2024 | 3.35 | 42,707 |
| 58 | Uruguay | Latin America & Caribbean | 2024 | 3.23 | 7,187 |
| 59 | Italy | Europe & Central Asia | 2024 | 3.09 | 115,689 |
| 60 | Israel | Middle East, North Africa, Afghanistan & Pakistan | 2024 | 2.92 | 17,470 |
| 61 | Guyana | Latin America & Caribbean | 2024 | 2.90 | 1,546 |
| 62 | Uzbekistan | Europe & Central Asia | 2024 | 2.79 | 64,020 |
| 63 | Zimbabwe | Sub-Saharan Africa | 2024 | 2.77 | 25,601 |
| 64 | Rwanda | Sub-Saharan Africa | 2024 | 2.72 | 22,734 |
| 65 | Fiji | East Asia & Pacific | 2024 | 2.70 | 1,665 |
| 66 | Morocco | Middle East, North Africa, Afghanistan & Pakistan | 2024 | 2.66 | 67,138 |
| 67 | Slovenia | Europe & Central Asia | 2024 | 2.62 | 3,545 |
| 68 | Jamaica | Latin America & Caribbean | 2024 | 2.60 | 5,393 |
| 69 | Greece | Europe & Central Asia | 2024 | 2.45 | 16,000 |
| 70 | Malaysia | East Asia & Pacific | 2024 | 2.38 | 59,611 |
| 71 | Poland | Europe & Central Asia | 2024 | 2.38 | 56,520 |
| 72 | Albania | Europe & Central Asia | 2024 | 2.29 | 4,126 |
| 73 | Russian Federation | Europe & Central Asia | 2024 | 2.28 | 214,957 |
| 74 | Colombia | Latin America & Caribbean | 2024 | 2.22 | 82,208 |
| 75 | Kyrgyz Republic | Europe & Central Asia | 2024 | 2.15 | 9,638 |
| 76 | Kuwait | Middle East, North Africa, Afghanistan & Pakistan | 2024 | 2.14 | 8,357 |
| 77 | Lithuania | Europe & Central Asia | 2024 | 2.13 | 4,011 |
| 78 | Serbia | Europe & Central Asia | 2024 | 2.12 | 8,788 |
| 79 | Cyprus | Europe & Central Asia | 2024 | 2.08 | 14,444 |
| 80 | Azerbaijan | Europe & Central Asia | 2024 | 2.00 | 14,215 |
| 81 | Viet Nam | East Asia & Pacific | 2024 | 2.00 | 136,757 |
| 82 | Turkiye | Europe & Central Asia | 2024 | 1.98 | 115,401 |
| 83 | Tunisia | Middle East, North Africa, Afghanistan & Pakistan | 2024 | 1.82 | 14,870 |
| 84 | Paraguay | Latin America & Caribbean | 2024 | 1.76 | 7,915 |
| 85 | Thailand | East Asia & Pacific | 2024 | 1.75 | 87,596 |
| 86 | Kenya | Sub-Saharan Africa | 2024 | 1.73 | 58,919 |
| 87 | Bosnia and Herzegovina | Europe & Central Asia | 2024 | 1.64 | 3,369 |
| 88 | Ecuador | Latin America & Caribbean | 2024 | 1.59 | 19,317 |
| 89 | Gabon | Sub-Saharan Africa | 2024 | 1.57 | 2,373 |
| 90 | Lao PDR | East Asia & Pacific | 2024 | 1.57 | 7,941 |
| 91 | Angola | Sub-Saharan Africa | 2024 | 1.55 | 30,956 |
| 92 | Zambia | Sub-Saharan Africa | 2024 | 1.50 | 18,109 |
| 93 | Germany | Europe & Central Asia | 2024 | 1.44 | 75,775 |
| 94 | Gambia, The | Sub-Saharan Africa | 2024 | 1.40 | 2,196 |
| 95 | Ghana | Sub-Saharan Africa | 2024 | 1.37 | 28,529 |
| 96 | Senegal | Sub-Saharan Africa | 2024 | 1.22 | 13,136 |
| 97 | El Salvador | Latin America & Caribbean | 2024 | 1.14 | 4,862 |
| 98 | Uganda | Sub-Saharan Africa | 2024 | 1.08 | 29,330 |
| 99 | St. Lucia OFC | Latin America & Caribbean | 2024 | 1.06 | 139 |
| 100 | Togo | Sub-Saharan Africa | 2024 | 1.04 | 5,665 |
| 101 | Guatemala | Latin America & Caribbean | 2024 | 1.02 | 11,909 |
| 102 | Burundi | Sub-Saharan Africa | 2024 | 0.98 | 7,263 |
| 103 | Mexico | Latin America & Caribbean | 2024 | 0.95 | 83,950 |
| 104 | Indonesia | East Asia & Pacific | 2024 | 0.94 | 182,200 |
| 105 | Algeria | Middle East, North Africa, Afghanistan & Pakistan | 2024 | 0.83 | 24,482 |
| 106 | Mauritania | Sub-Saharan Africa | 2024 | 0.83 | 2,329 |
| 107 | Burkina Faso | Sub-Saharan Africa | 2024 | 0.77 | 10,046 |
| 108 | Comoros | Sub-Saharan Africa | 2024 | 0.76 | 387 |
| 109 | Sierra Leone | Sub-Saharan Africa | 2024 | 0.73 | 3,712 |
| 110 | Tonga | East Asia & Pacific | 2024 | 0.70 | 42 |
| 111 | Benin | Sub-Saharan Africa | 2024 | 0.69 | 5,522 |
| 112 | Guinea | Sub-Saharan Africa | 2024 | 0.69 | 5,626 |
| 113 | Djibouti | Middle East, North Africa, Afghanistan & Pakistan | 2024 | 0.68 | 521 |
| 114 | Jordan | Middle East, North Africa, Afghanistan & Pakistan | 2024 | 0.67 | 5,009 |
| 115 | Ethiopia | Sub-Saharan Africa | 2024 | 0.61 | 46,274 |
| 116 | Japan | East Asia & Pacific | 2024 | 0.58 | 41,946 |
| 117 | Argentina | Latin America & Caribbean | 2024 | 0.52 | 15,818 |
| 118 | Philippines OFC | East Asia & Pacific | 2024 | 0.51 | 39,146 |
| 119 | Brunei Darussalam | East Asia & Pacific | 2024 | 0.47 | 157 |
| 120 | Guinea-Bissau | Sub-Saharan Africa | 2024 | 0.47 | 598 |
| 121 | Cambodia | East Asia & Pacific | 2024 | 0.45 | 5,138 |
| 122 | Congo, Rep. | Sub-Saharan Africa | 2024 | 0.40 | 1,437 |
| 123 | Honduras | Latin America & Caribbean | 2024 | 0.37 | 2,628 |
| 124 | Pakistan | Middle East, North Africa, Afghanistan & Pakistan | 2024 | 0.20 | 30,004 |
| 125 | India | South Asia | 2024 | 0.18 | 173,712 |
| 126 | West Bank and Gaza | Middle East, North Africa, Afghanistan & Pakistan | 2024 | 0.17 | 525 |
| 127 | Chad | Sub-Saharan Africa | 2024 | 0.13 | 1,391 |
| 128 | Madagascar | Sub-Saharan Africa | 2024 | 0.12 | 2,206 |
| 129 | Congo, Dem. Rep. coverage note | Sub-Saharan Africa | 2024 | 0.11 | 6,095 |
| 130 | Central African Republic | Sub-Saharan Africa | 2024 | 0.10 | 258 |
| 131 | Niger | Sub-Saharan Africa | 2024 | 0.10 | 1,371 |
| 132 | Bangladesh | South Asia | 2024 | 0.06 | 7,365 |
| 133 | Liberia OFC | Sub-Saharan Africa | 2024 | 0.05 | 167 |
| 134 | Somalia, Fed. Rep. | Sub-Saharan Africa | 2024 | 0.02 | 195 |
49 economies have new business density in this extract, but not for 2024. The year shown is the latest one on file. Do not read these values as 2024 observations. The latest-year density list mixes those years and prints the year on each row. 34 economies have no density series. The United States is one of them. Absence is blank, not zero.
| Economy | Year | New business density | New registrations |
|---|---|---|---|
| Afghanistan | 2018 | 0.22 | 4,274 |
| Austria | 2023 | 1.00 | 5,982 |
| Belarus | 2022 | 1.27 | 7,820 |
| Belgium | 2023 | 5.31 | 39,772 |
| Bhutan | 2022 | 0.07 | 40 |
| Bolivia | 2023 | 0.47 | 3,712 |
| Canada coverage note | 2022 | 5.17 | 131,783 |
| Chile | 2023 | 9.09 | 123,159 |
| Dominican Republic | 2018 | 1.45 | 10,204 |
| Egypt, Arab Rep. | 2022 | 0.26 | 18,587 |
| Grenada OFC | 2020 | 2.74 | 217 |
| Haiti | 2010 | 0.07 | 383 |
| Iran, Islamic Rep. | 2020 | 0.60 | 36,158 |
| Iraq | 2022 | 0.12 | 3,037 |
| Kiribati | 2018 | 0.03 | 2 |
| Korea, Rep. | 2023 | 3.51 | 128,455 |
| Lesotho | 2020 | 1.47 | 1,981 |
| Malawi | 2009 | 0.09 | 619 |
| Maldives | 2023 | 4.85 | 1,928 |
| Mali | 2020 | 0.25 | 2,741 |
| Marshall Islands OFC | 2022 | 0.20 | 5 |
| Micronesia, Fed. Sts. | 2018 | 0.37 | 25 |
| Mozambique | 2020 | 0.25 | 3,925 |
| Myanmar | 2018 | 0.39 | 14,051 |
| Nepal | 2020 | 1.40 | 25,859 |
| Netherlands | 2022 | 3.41 | 39,055 |
| Nigeria | 2022 | 1.12 | 136,961 |
| Oman | 2020 | 1.79 | 5,804 |
| Panama OFC | 2022 | 4.52 | 13,048 |
| Papua New Guinea | 2020 | 0.67 | 4,109 |
| Puerto Rico (US) | 2020 | 5.33 | 11,218 |
| Qatar | 2018 | 6.77 | 14,824 |
| Samoa OFC | 2022 | 0.72 | 86 |
| Sao Tome and Principe | 2020 | 2.19 | 268 |
| Sint Maarten (Dutch part) OFC | 2021 | 12.49 | 369 |
| Solomon Islands | 2018 | 1.09 | 444 |
| South Sudan | 2016 | 0.30 | 1,765 |
| Sri Lanka | 2022 | 1.19 | 17,447 |
| St. Vincent and the Grenadines OFC | 2020 | 4.66 | 323 |
| Suriname | 2022 | 2.77 | 1,147 |
| Switzerland | 2022 | 3.13 | 18,034 |
| Tajikistan | 2018 | 0.15 | 831 |
| Tanzania | 2018 | 0.17 | 5,276 |
| Timor-Leste | 2022 | 2.34 | 1,911 |
| Trinidad and Tobago | 2020 | 4.49 | 4,344 |
| Tuvalu | 2022 | 1.13 | 7 |
| Ukraine | 2017 | 1.65 | 51,349 |
| United Arab Emirates | 2020 | 2.48 | 19,050 |
| Vanuatu OFC | 2018 | 1.58 | 258 |
American Samoa; Andorra; Aruba; Bahamas, The; Bermuda; British Virgin Islands; Cameroon; Channel Islands; Cuba; Curacao; Equatorial Guinea; Eritrea; Faroe Islands; French Polynesia; Gibraltar; Greenland; Guam; Korea, Dem. People's Rep.; Lebanon; Libya; Macao SAR, China; Monaco; New Caledonia; Nicaragua; Northern Mariana Islands; Palau; San Marino; St. Martin (French part); Sudan; Syrian Arab Republic; Turkmenistan; United States; Venezuela, RB; Yemen, Rep..
Reporting is not stable. The count of economies with a density value peaked at 173 in 2018 and is 134 in 2024. A lower count is not evidence that fewer businesses opened.
| Year | Economies with a density value |
|---|---|
| 2006 | 130 |
| 2007 | 132 |
| 2008 | 141 |
| 2009 | 147 |
| 2010 | 146 |
| 2011 | 150 |
| 2012 | 153 |
| 2013 | 160 |
| 2014 | 164 |
| 2015 | 166 |
| 2016 | 169 |
| 2017 | 171 |
| 2018 | 173 |
| 2019 | 165 |
| 2020 | 166 |
| 2021 | 150 |
| 2022 | 154 |
| 2023 | 140 |
| 2024 | 134 |
The World Bank methodology says data for economies that Eurostat lists as offshore financial centers are collected and published, then excluded from the World Bank's own trend analysis, because many registrations may be shell companies. The 2024 values for economies in this extract that are on that list:
| # | Economy | Year | New business density | New registrations |
|---|---|---|---|---|
| 1 | Cayman Islands OFC | 2024 | 201.01 | 11,197 |
| 2 | Isle of Man OFC | 2024 | 33.58 | 1,770 |
| 3 | Hong Kong SAR, China OFC | 2024 | 28.85 | 145,053 |
| 4 | Turks and Caicos Islands OFC | 2024 | 23.74 | 803 |
| 5 | Virgin Islands (U.S.) OFC | 2024 | 19.96 | 1,267 |
| 6 | St. Kitts and Nevis OFC | 2024 | 18.72 | 619 |
| 7 | Liechtenstein OFC | 2024 | 15.57 | 407 |
| 8 | Naoero OFC | 2024 | 15.23 | 108 |
| 9 | Mauritius OFC | 2024 | 13.98 | 12,614 |
| 10 | Belize OFC | 2024 | 13.01 | 3,710 |
| 11 | Singapore OFC | 2024 | 11.59 | 52,248 |
| 12 | Barbados OFC | 2024 | 8.11 | 1,517 |
| 13 | Bahrain OFC | 2024 | 6.16 | 7,580 |
| 14 | Seychelles OFC | 2024 | 4.26 | 370 |
| 15 | Antigua and Barbuda OFC | 2024 | 4.16 | 275 |
| 16 | Dominica OFC | 2024 | 3.73 | 171 |
| 17 | St. Lucia OFC | 2024 | 1.06 | 139 |
| 18 | Philippines OFC | 2024 | 0.51 | 39,146 |
| 19 | Liberia OFC | 2024 | 0.05 | 167 |
Indicator codes: IC.BUS.NDNS.ZS and IC.BUS.NREG. Source URLs are in sources. The extract file is site/data/countries.json, generated 1 July 2026 by src/fetch.py. API metadata listed lastupdated 2026-10-08 when checked on 2026-11-06. On that date the full 2024 cross-section matched this extract for both indicators (134 economies, no mismatches). Checked records include Estonia, India, the United Kingdom, Brazil, the Cayman Islands, Nigeria (value in 2022, none in 2023 or 2024), and the United States (no value).
Transformation: Python round, half to even, to 2 decimal places for density and to a whole number for registrations. Pages use the stored history values. Missing stays missing. Medians of an even count average the two middle values and are shown to 2 decimal places. The one-year rule and the panel rule are stated on the 2024 findings page.